Surveys are an incredible way to gather insights, but they only work if people actually respond. If you’ve ever hit “send” on a customer feedback survey or employee poll and heard crickets… you’re not alone.
So what exactly is a good response rate, and how can you improve survey response rates to collect more meaningful data?
We’re going to unpack what response rate actually means, why it matters so much, and how teams just like yours are improving survey response rates with real-world strategies.
What is a Response Rate and Why Does It Matter?
Let’s start with the basics, like what is a response rate?
A response rate is the percentage of people who complete your survey out of the total number invited to take it. It’s a foundational metric that indicates the effectiveness of your survey strategy.
Response rates are important because they help determine how representative your data is. Low response rates can lead to biased results, while high rates mean more reliable, valid insights.
How to Calculate Response Rate
Before diving into benchmarks and strategy, it’s important to understand how the response rate compares to other related metrics:
- Response Rate: Percentage of total invited participants who responded.
- Completion Rate: Percentage of people who finished the survey out of those who started it.
- View Rate: Percentage of people who viewed the survey link or page.
Here’s the formula to calculate a response rate:
Response Rate = (# of Responses / # of People Invited) x 100
Seems simple, right? But it tells you a lot about your audience’s engagement, trust, and even how they perceive your brand.
Think about it: if only 3% of your customers respond to a satisfaction survey, can you really claim to understand what they think?
Low response rates often mean:
- Your survey didn’t feel relevant
- Timing was off
- Delivery method wasn’t right
- The survey experience was… well, not great
What Is Considered a Good Response Rate?
There’s no magic number that fits every scenario. What qualifies as a “good response rate” depends on several factors:
- Audience Type: Internal employees often respond at higher rates than external customers.
- Distribution Method: Email, SMS, QR codes, in-app messages. Depending on which you use, they all perform differently.
- Survey Length: Shorter surveys yield better response rates than longer ones due to less dropoff!
- Survey Type: Whether it’s market research, customer satisfaction, or product feedback, responses rates will vary.
Typical Benchmarks by Survey Type
Not all surveys are created equal, and neither are their response rates.
What’s considered a good response rate really hinges on who you’re surveying, why, and how you’re reaching them. Let’s walk through some common types of surveys and what kind of participation benchmarks you can realistically expect from each:
Employee Surveys
These tend to have the highest response rates, typically ranging between 30% to 60%. Why so high? Well, employees often feel more invested in their workplace culture and want their voices heard.
Customer Feedback Surveys
With customers, the stakes are a bit different. They don’t have to answer your questions, so their willingness to respond depends a lot on timing, perceived value, and the overall experience. Most customer surveys see response rates between 10% and 30%.
Market Research Surveys
These are the hardest to crack. Cold outreach to a broad audience means you’re often asking total strangers to give up their time. Expect lower response rates here, typically between 5% and 20% depending on your incentive and targeting.
Email-Based Surveys
If you’re relying on email alone, brace yourself. Unless your audience is highly engaged or internal (like employees), response rates tend to hover between 5% and 15%. Emails get buried, ignored, or land in spam. For these, it’s all about crafting killer subject lines and follow-ups.
In-App Surveys
Now, this is where things get interesting. In-app or in-product surveys often pull in response rates between 20% and 40%, especially if triggered at the right moment. The experience feels natural, timely, and frictionless.
Let’s say a fintech startup uses Agolix to gather post-onboarding feedback via in-app surveys. By keeping the survey to five questions and using a clean, mobile-friendly design, they could expect to achieve a 38% response rate; well above the industry average.
Why Maintaining a Good Response Rate Matters
High response rates aren’t just about bragging rights. They deliver real business value. Imagine running an employee engagement survey and only hearing from your most enthusiastic team members. That skews your data, right?
It’s easy to think of response rates as just another metric to hit, or a number to check off a list. But when you dig a little deeper, you realize that a high survey response rate isn’t just about performance. It’s about meaningful insights and business impact.
When you improve your response rates, you get:
- More Representative Data: Reduces bias, increases accuracy. When your response rate is strong, your data tells a more complete story. That broader input makes your data more representative, more accurate, and ultimately, more useful.
- Higher Validity & Reliability: With a fuller picture, your conclusions aren’t just guesses; they’re grounded in reality. You can make decisions with greater confidence.
- Actionable Insights: A good response rate doesn’t just give you better data. It helps you become a better listener. Whether you’re reshaping your onboarding process or building out internal initiatives, there is more data to act upon.
- Trust & Engagement: When people see that their feedback is valued and leads to real change, they’re far more likely to participate again. A good response rate today sets the foundation for even stronger engagement tomorrow. It builds trust and strengthens relationships for the future.
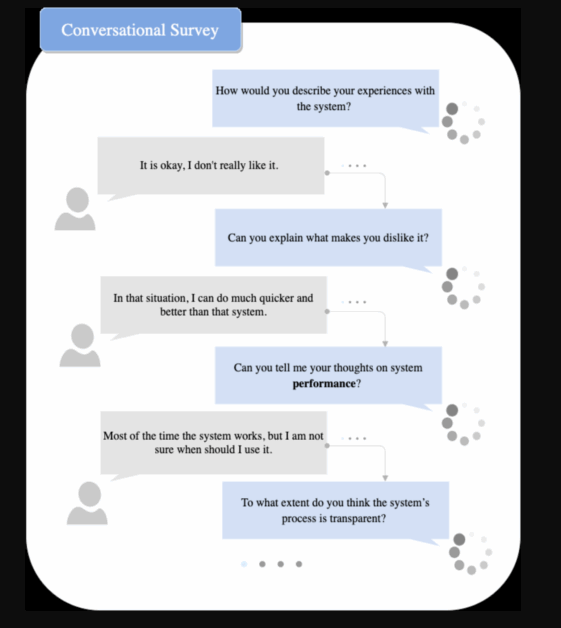
Companies that consistently hit strong response rates treat their surveys like conversations, not just data requests. You can see this in the example below from ResearchGate:
Factors That Influence Survey Response Rates
Creating a survey might seem simple on the surface, but getting people to actually respond? That’s where things get tricky.
To boost your response rate, you need to understand what influences whether someone clicks through and completes your survey or ignores it entirely. It’s not just about the questions you ask; it’s the experience you build around them.
Let’s break down the key factors that affect how many people engage with your surveys:
1. Survey Length and Complexity
Let’s be honest. Nobody wants to answer a 20-minute survey unless they’re getting paid for it. The longer your survey, the more likely people are to abandon it halfway through, especially if it’s packed with open-ended questions that require effort.
Think of your survey as a conversation. If it drags on, people mentally check out. On the other hand, a concise, focused survey is much more likely to get completed.
A great rule of thumb? Keep it under 10 questions and aim for a completion time of five minutes or less. If you’re collecting deep insights, consider splitting the survey into parts or targeting smaller segments with tailored questions.
2. Timing and Frequency
Timing can make or break your survey’s performance. Sending a feedback request at 5 PM on a Friday? Expect crickets. Launching a company-wide survey during the holiday season? Not ideal.
You want to reach people when they’re available and mentally present. Mid-morning on a weekday is often a sweet spot, especially for professional audiences. And don’t forget about frequency, as over-surveying your audience can lead to “survey fatigue,” where people start ignoring your requests altogether.
Brands that do this well often use analytics to test different send times and track what works best for their unique audience.
3. Audience Relevance
Why should someone bother responding to your survey?
If your audience doesn’t see personal relevance or benefit, they’re likely to skip it. People are far more willing to engage when they understand what the survey is for, why their input matters, and how the results will be used.
Whether you’re surveying customers or employees, be clear about the “why.” Tell them how their feedback will influence future decisions or lead to improvements. Better yet, show them how it’s made a difference in the past.
4. Survey Distribution Channel
Not all delivery channels perform equally. Email surveys typically yield lower response rates compared to SMS or in-app delivery methods. Why? Email inboxes are crowded, and it’s easy for surveys to get buried or ignored.
On the other hand, in-app or SMS-based surveys are more immediate. They feel relevant in the moment and don’t interrupt the user’s workflow.
Internal surveys, like those sent to employees, also tend to outperform external ones because there’s a built-in sense of connection and accountability.
5. Trust, Branding, and Personalization
When someone opens a survey invite, one of their first thoughts is, “Is this legit?”
That’s why branding and personalization aren’t just nice-to-haves. They’re essential. Emails that are personalized (using the recipient’s name, role, or past interactions) are much more likely to be opened. Branded surveys, complete with your logo and company colors, build trust and signal professionalism.
But trust goes even deeper. If you’re not upfront about how their data will be used, people may bail. Be transparent about privacy, clearly state if the survey is anonymous, and always give participants a sense of control.
6. Technical Friction
Even the most thoughtfully designed survey can flop if the experience is clunky. Technical friction is one of the fastest ways to lose potential respondents.
Imagine opening a survey link on your phone only to be met with a zoomed-out desktop version. Even worse, a request to create an account before proceeding. Most people will close the tab right then and there.
To avoid this, make sure your surveys are mobile-optimized, fast-loading, and don’t require logins. Every extra step is an opportunity for someone to drop off.
In the end, boosting your response rate is all about empathy. Think like your audience. Would you take the survey you’re sending out? Does it feel timely, easy, trustworthy, and worth the time?
If the answer is yes, then you’re on the right track.
7 Strategies to Improve Survey Response Rates
Let’s move from theory to action.
You’ve got your survey ready, but how do you make sure people actually respond? These tried-and-true strategies can help you increase your response rate and collect more meaningful data.
Here’s seven ways real teams are turning low engagement around, and how you can too.
1. Optimize Your Survey Design
Survey design is the foundation. If it’s clunky, long, or confusing, even your most loyal participants will drop off halfway through.
- Keep it short (ideally under 10 questions).
- Use plain language and a logical flow.
2. Offer Incentives
Sometimes, people just need a little nudge. Offering an incentive can be a powerful motivator, especially when you’re asking for time and thoughtful input.
Gift cards, discounts, or early access to features are all proven options that increase participation.That said, be cautious with the size or type of reward. Overly generous incentives can attract the wrong crowd.
3. Communicate Value
People are far more likely to respond when they understand what’s in it for them, or how their input will make a difference. That means framing your survey as more than a data collection exercise. It should feel like an invitation to contribute to something meaningful.
- Let them know how feedback has been used in the past to improve products, services, or internal processes.
- Promise (and follow through!) on sharing updates once the survey closes.
In sensitive contexts like employee surveys, reassure them about confidentiality and how their data will be protected.
4. Improve Your Survey Invitations
Your survey invite is your first impression, and first impressions matter. A dull or generic email won’t stand out in a crowded inbox.
- Personalize your subject lines and greetings to immediately make the message feel relevant.
- Let people know how long the survey will take.
- Deadlines create urgency, so include a clear end date to encourage prompt responses rather than letting your invite gather dust.
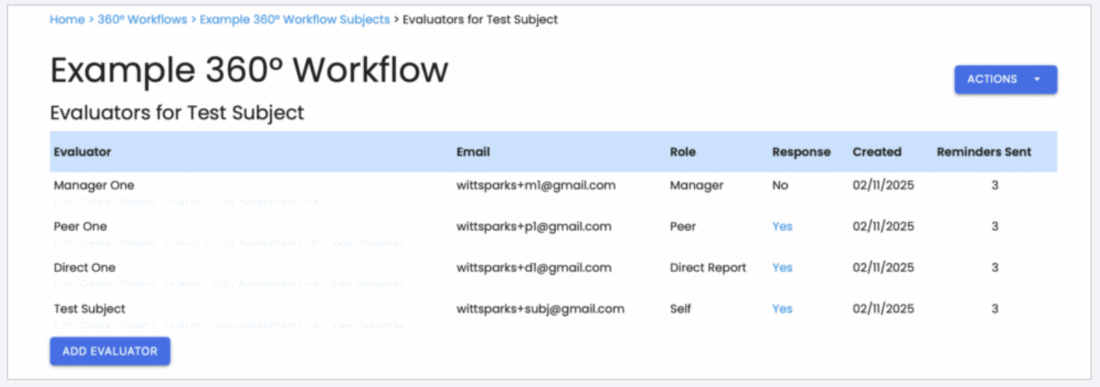
5. Send Friendly Reminders
Most people won’t respond to your survey on the first try, and that’s totally normal. Strategic, well-timed reminders can significantly boost participation without coming across as too pushy.
- Aim for 1 to 3 reminders, spaced out over several days.
- Avoid sending them all at once. Timing matters, and giving people breathing room shows respect.
- To keep it interesting, change the subject line or messaging with each reminder. It helps avoid “email fatigue” and grabs attention.
6. Reduce Technical Barriers
Even if someone wants to take your survey, a bad user experience can stop them cold. Every extra step or glitch is a reason to close the tab.
- Ensure your survey is fully mobile-optimized, as most people check their email or texts on their phones first.
- Remove friction points like mandatory logins or account creation, which add unnecessary complexity.
- Prioritize fast load times. A slow-loading survey is an easy one to abandon.
7. Use the Best Channel
Where you deliver your survey is just as important as what you’re asking. Different audiences respond better to different formats.
- Email remains effective for professional audiences, especially in B2B contexts.
- For faster responses or more casual interactions, SMS or in-app prompts tend to perform better.
- Running a live event, hosting a product demo, or managing a retail space? QR codes are great for collecting feedback on the spot.
- Don’t be afraid to mix channels! A multichannel strategy often leads to the best results, meeting people wherever they’re most active.
How Agolix Helps Improve Response Rates
Agolix thrives on helping teams collect better feedback, starting with better response rates. Agolix makes it easy to create assessments and surveys that boost engagement.
With a user-friendly interface, customizable templates, and seamless integration options, the platform helps ensure that your surveys are accessible and engaging. Plus, automated reminders and tracking features take the guesswork out of follow-ups, helping you maintain high response rates.
Explore more of Agolix’s features or check out our User Guide to learn how to optimize your next survey.
Improve Your Response Rates with Agolix
If you’ve been wondering what a good response rate for surveys is, here’s the big takeaway: it depends on who you’re surveying, how you’re asking, and what you’re asking them to do. There’s no universal “good” number, but aiming for a 20-30% response rate is a solid benchmark for external surveys. For internal surveys, you should expect even higher.
To consistently hit those numbers, it all comes down to how you design and deliver your surveys. Keep them short, communicate clearly, and choose the right channels with prioritizing personalization. Above all, remove the friction that keeps people from engaging.
That’s where Agolix comes in.
With Agolix, you get a survey and assessment platform built to drive results. Whether you’re gathering employee feedback, customer insights, or research data, Agolix helps you boost participation, gather better data, and make smarter decisions without the manual effort.
The most successful survey programs are the ones that respect their audience’s time, communicate clearly, and use the right tools. Agolix helps you to streamline the entire experience.
If you’re ready to boost your survey or assessment response rates, explore how Agolix can increase participation here today!