Content Blocks are the foundation of your PDF Report, offering drag-and-drop functionality for a customized design and ultimate flexibility.
Add Text Blocks #
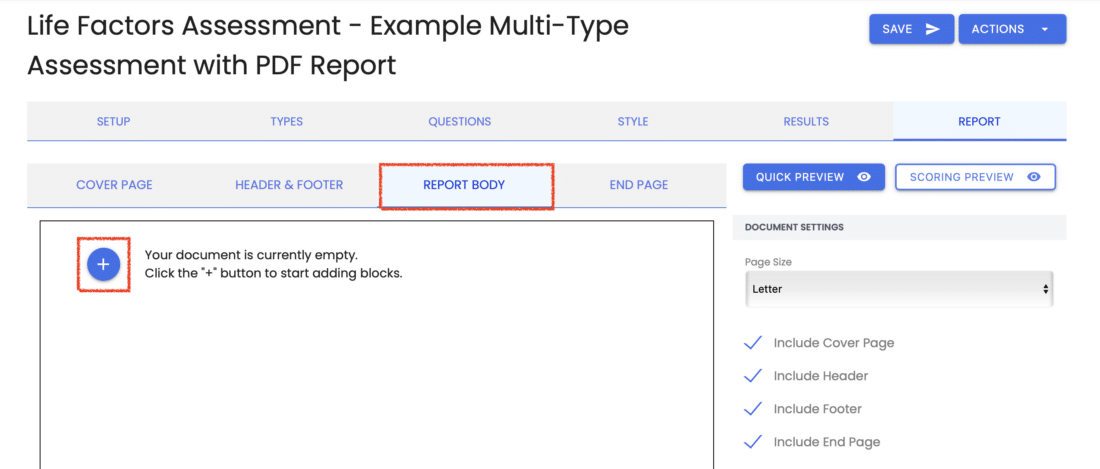
In the “Report Body” tab, click the blue “+” sign to add a content Block.
Note: The blue “+” sign also works in the “Cover Page“and “End Page” tabs, if applicable.
Select Text to add a Text Block, then click “Close“.

Edit a Text Block #
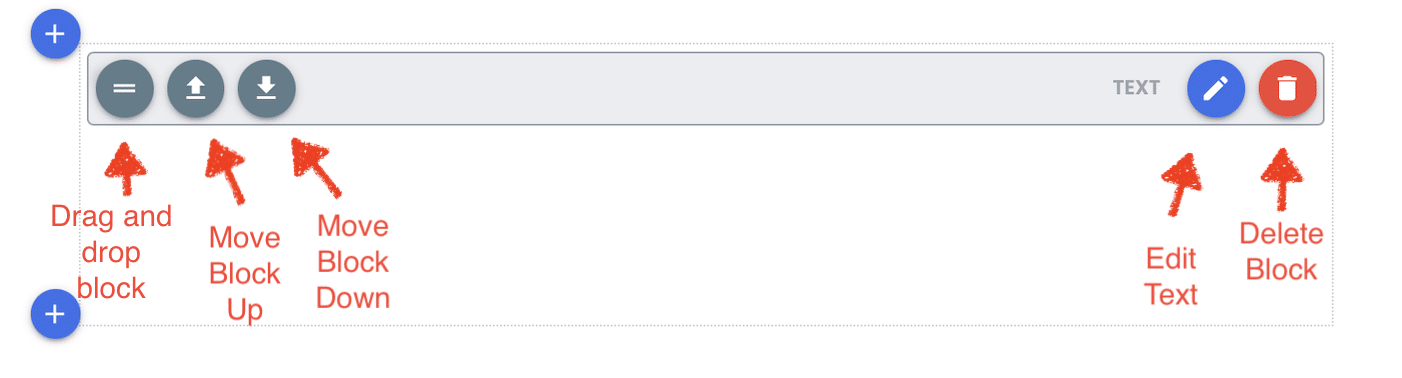
Select the blue pencil icon to add content to this Block.
Note: The top bar of each Block includes a Drag and Drop button, Up Arrow (to move it’s position up the Page), Down Arrow (to move down the page), Edit content button, and Delete Block button.
When you click Edit, you’ll see an editor window where you can add your Text Properties.
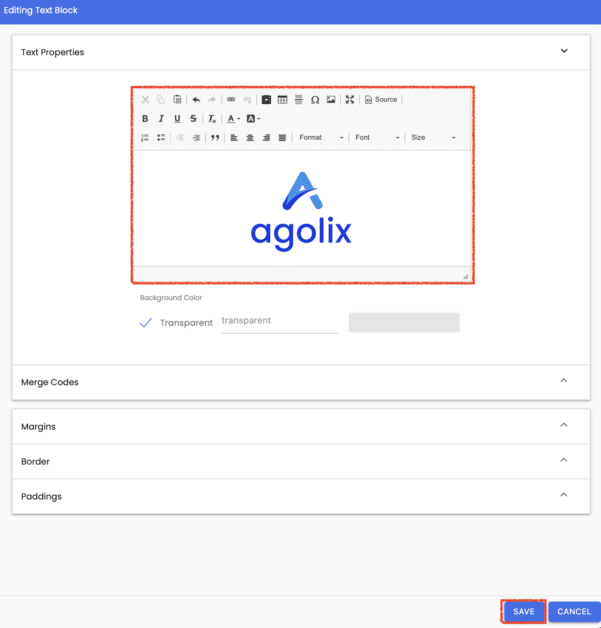
Refer to Editor Window Explained for more information on the icons available here.
Add a Block Background Color #
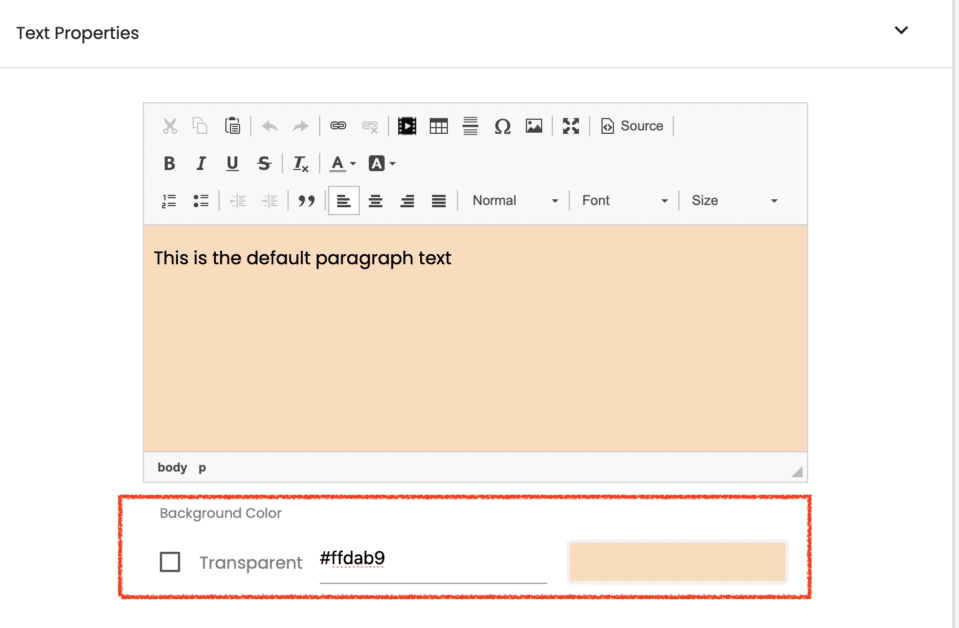
By default, the background of each Block is set as Transparent.
Uncheck the Transparent box to add a Background Color. Enter a hex code or HTML color name in the field provided, or click on the box to the right to use the eye drop color picker or enter your RGB, HSL, or Hex code.
Note: Check out this handy guide to HTML Color names.
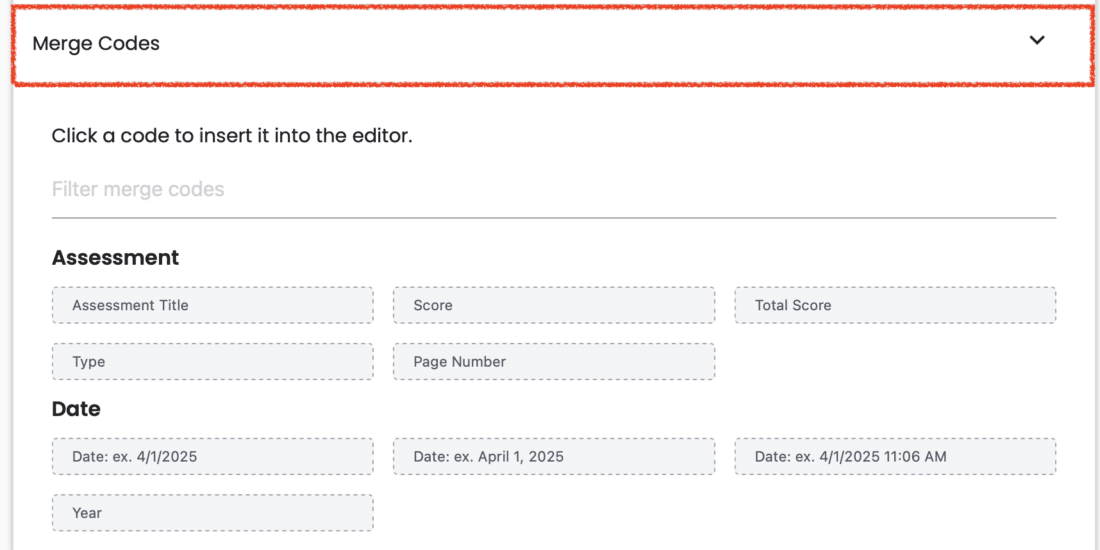
Use Merge Codes #
Click on “Merge Codes” and you’ll see a menu of available merge codes. Select the one(s) you want or enter a search string into the “Filter merge codes” field to locate a specific merge code quickly.
See more details on Merge Codes.
Margins, Border, & Paddings #
Also configurable here are the Block Margins, Border and Paddings. To learn more about Margins, Border, and Paddings, please see Block Spacing Settings.
Save Changes #
Click the “Save” button to save your work.
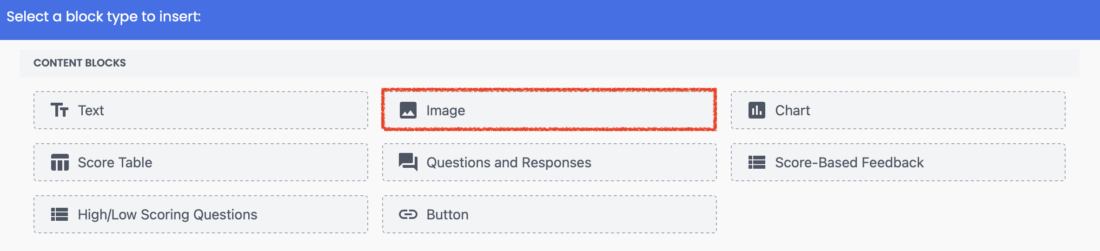
Add an Image Block #
This menu appears when you click the blue “+“ sign to add a Block. Select the “Image” button then click the “Close” button to add an image to your Block.
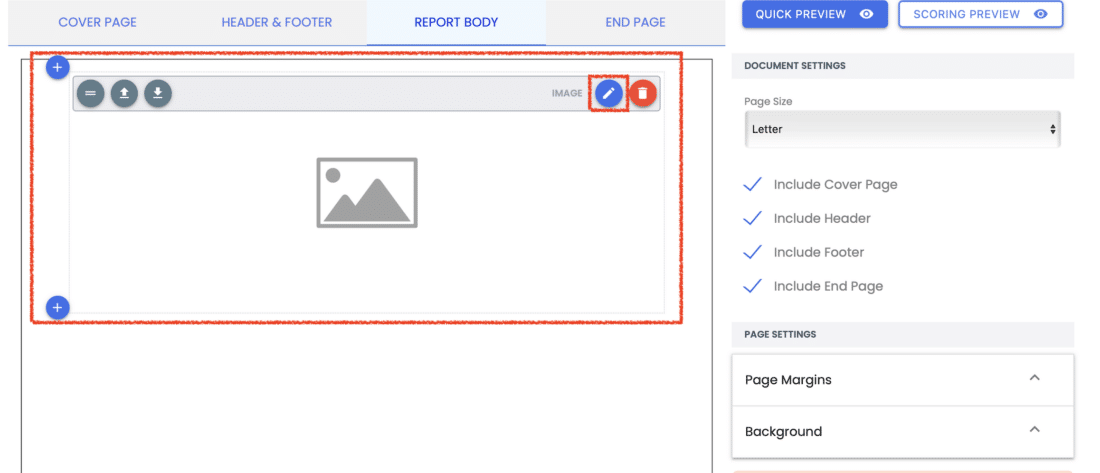
Once the block has been created, a Placeholder for your image is shown.
Note: The initial placeholder size does not indicate the actual space the content will take up in the Report. Use the Quick Preview button for an accurate representation of your report.
Click the blue Edit button to add your chosen image.
From here, click the Upload button to add an image to the File Manager for your account and click “Confirm” to add the image to this block. Click the “Save” button to save your work.
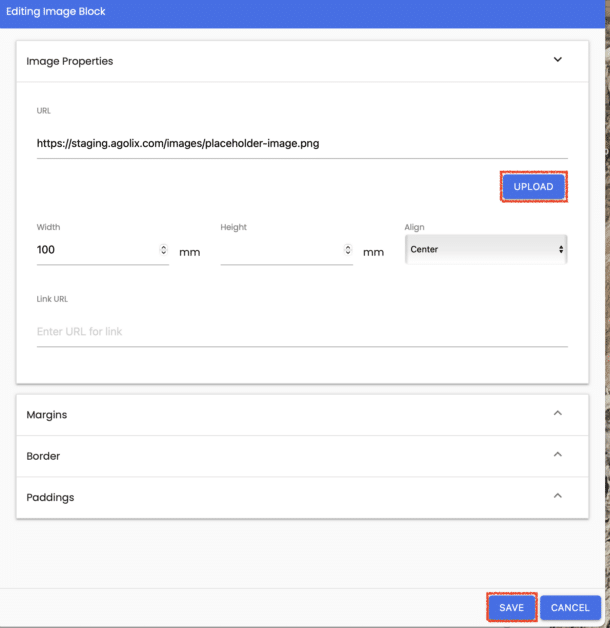
Image Width and Alignment #
Once your image is added to your block, you can set the image Width and Height in millimeters and the image Alignment.
Alternatively, you can add a URL for an image that is remotely stored on the internet.
Margins, Border, & Paddings #
Also configurable here are the Block Margins, Border and Paddings. To learn more about Margins, Border, and Paddings, please see Block Spacing Settings.
Save Changes #
Click the “Save” button to save your work.
Add a Chart Block #
This menu appears when you click the blue “+“ sign to add a Block. Click “Chart” then Click “Close” to add a chart block to your report.
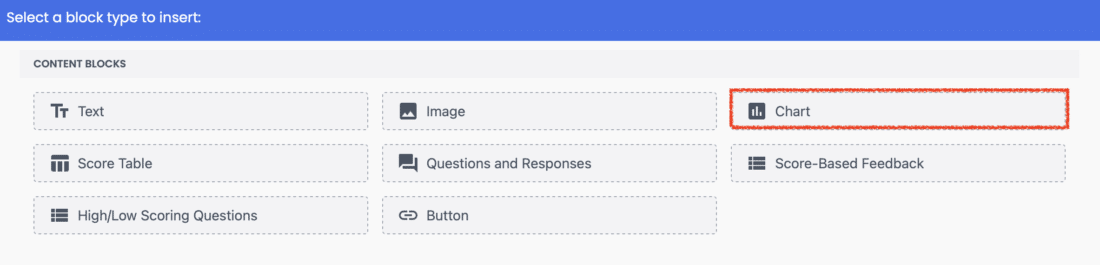
Chart Width and Alignment #
Once the block has been created, a Placeholder for your chart is shown.
Note: The placeholder size does not indicate the actual space the content will take up in the Report. Use the Quick Preview button for an accurate representation of your Report.
Click the blue Edit button to adjust the chart Width and Alignment on the page.
Gauge charts are shown for Simple Assessments. For Multi-Type Assessments, the chart style preference can be selected on the Types tab in the Agolix editor.
See Convey Results in Style with Charts for descriptions of each chart style.
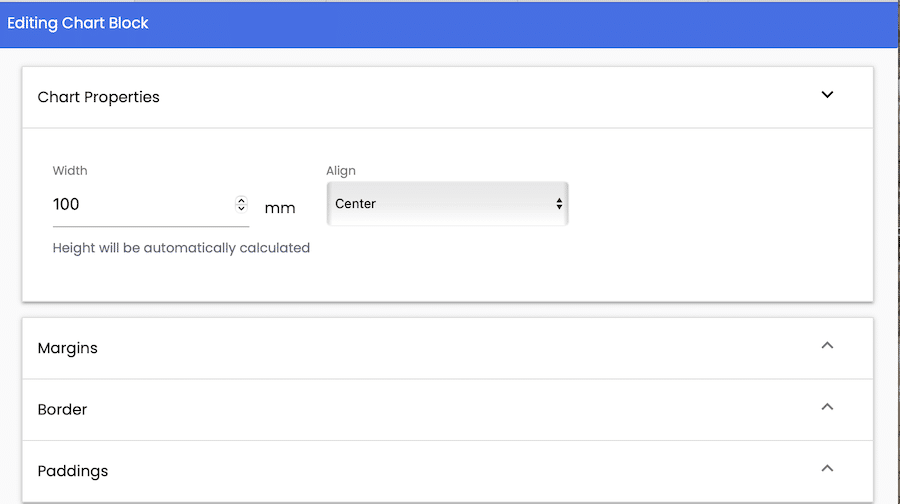
Margins, Border, & Paddings #
Also configurable here are the Block Margins, Border and Paddings. To learn more about Margins, Border, and Paddings, please see Block Spacing Settings.
Save Changes #
Click the “Save” button to save your work.
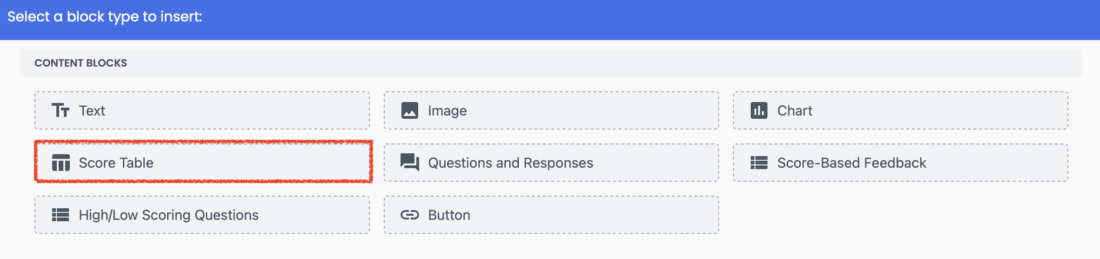
Add Score Table #
This menu appears when you click the blue “+“ sign to add a Block. Click “Score Table” then Click “Close” to add this block to your report.
Edit the Score Table block and Check the box to Show Total Average Score under Score table Properties.

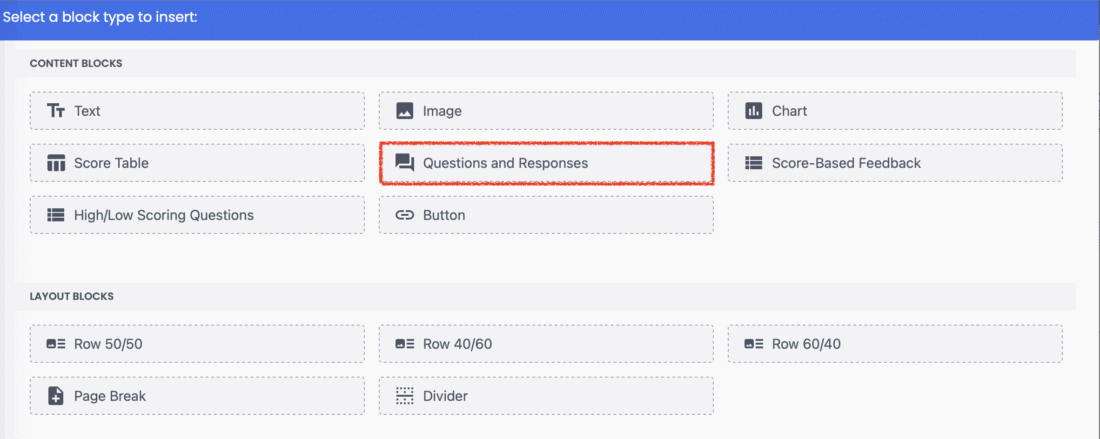
Add a Questions and Responses Block #
When you click the blue “+” sign, click “Questions and Responses” then “Close” to add a Block with a list of your Assessment Questions and your respondent’s answers to each.
Show Question Notes #
Once the Block has been created, a Placeholder for your Questions and Responses Block is shown.
Note: The placeholder size does not indicate the actual space the content will take up in the Report. Use the Quick Preview button for an accurate representation of your Report.
Click the blue Edit button to see more options, such as a checkbox to Show Question Notes.
Check the box to show any Question Notes you may have added to your Assessment Questions. Also choose settings for Margins and Paddings if desired. Click “Save” to save your settings.
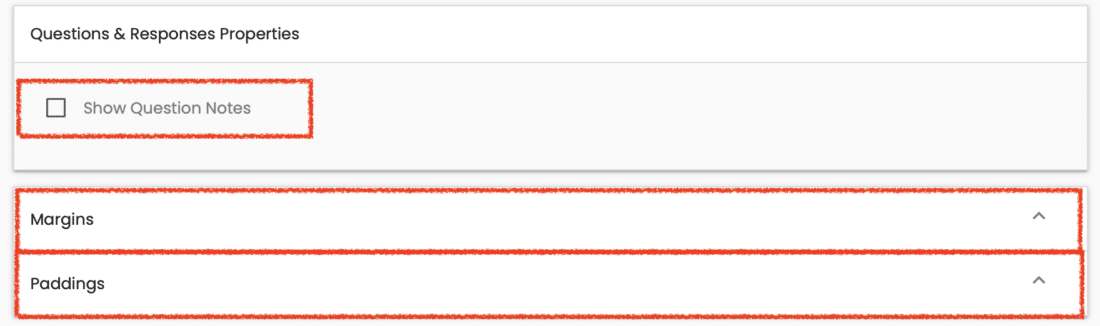
Margins & Paddings #
Also configurable here are the Block Margins and Paddings. To learn more about Margins and Paddings, please see Block Spacing Settings.
Save Changes #
Click the “Save” button to save your work.
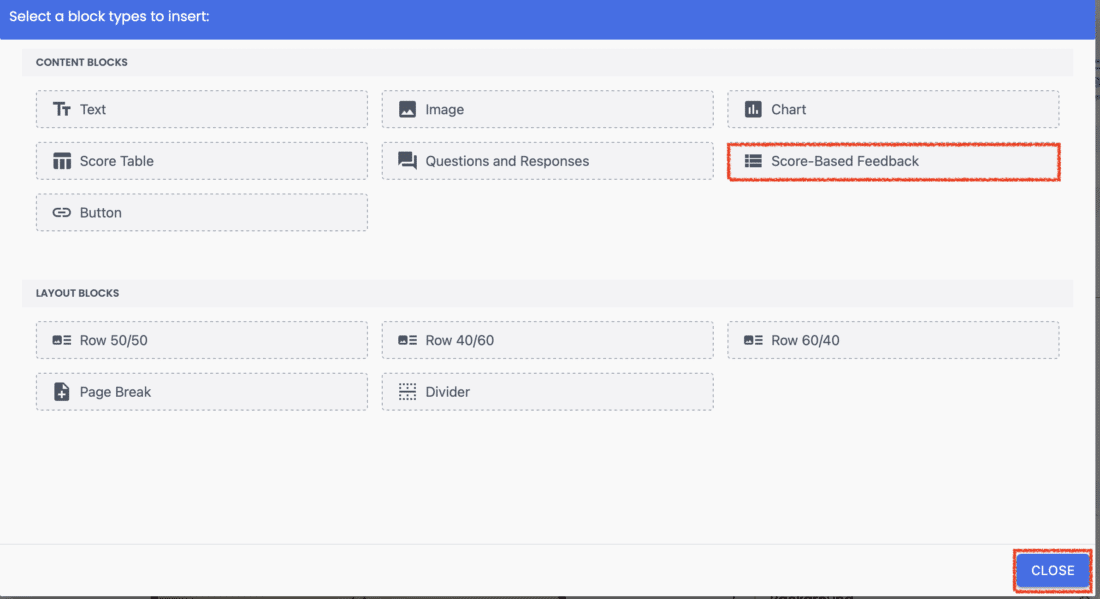
Add a Score-Based Feedback Block #
Click the blue “+” sign to add a block, select “Score-Based Feedback“ then “Close” to add this content to your Report.
Note: The placeholder size does not indicate the actual space the content will take up in the Report. Use the Quick Preview button for an accurate representation of your Report.
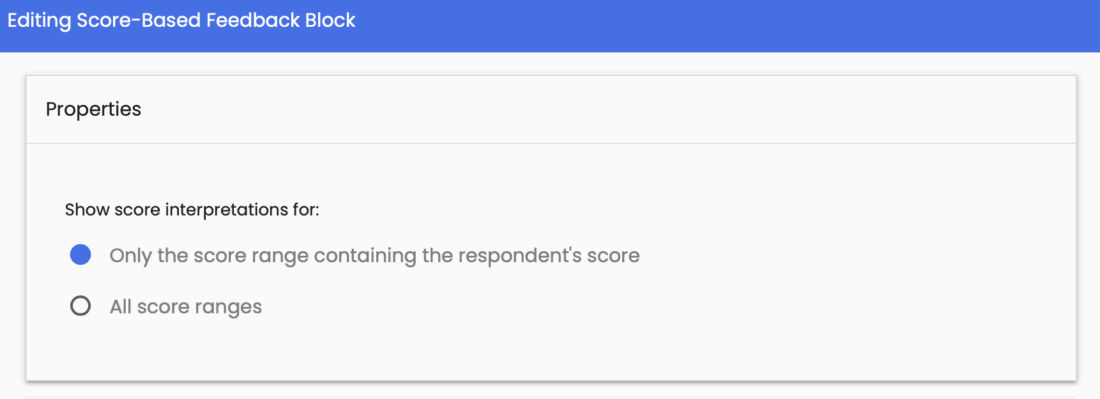
Click the blue Edit button to select the Score-Based Feedback Properties you’d like in your results Report.
Score-Based Feedback Options #
Simple Assessments #
With a Simple Assessment, choose between showing the Score Interpretation for (1) “Only the Score Range containing the respondent’s score” or (2) “All score ranges”.
Editing Types-Questions Block for Multi-Type Assessments #
Scores by Question #
- Include responses to narrative questions – select this only if you have asked narrative questions in your assessment (option to add a page break before)
- Insert page break between Types
Select any of the options from “Types Questions Properties” to display in your Report. Click “Save” when you’ve completed your selections.
- Include type title
- Include total average score
- Include Type description (option to add a page break before)
- Include score description
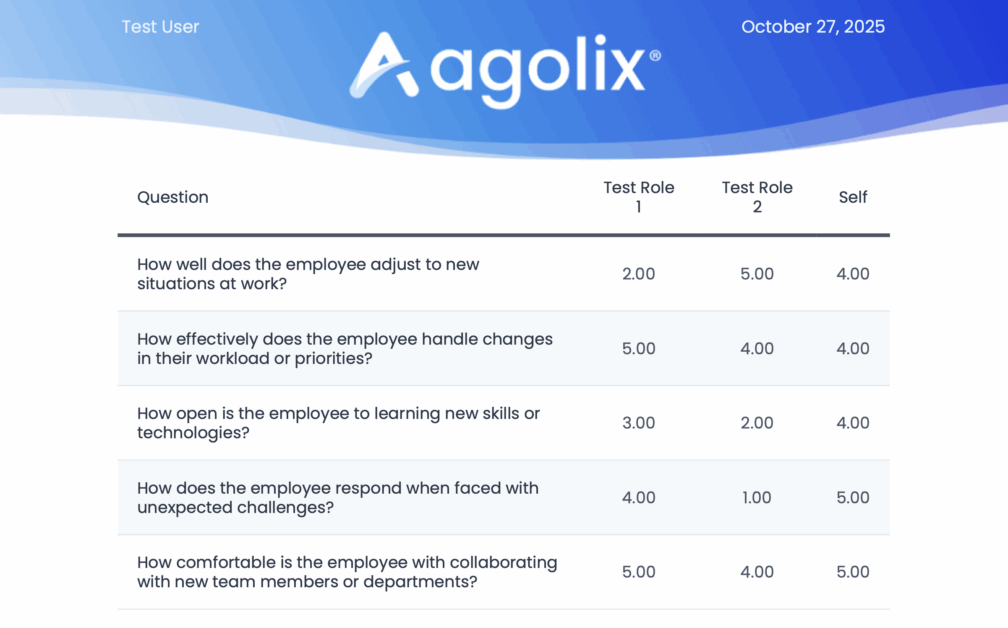
- Include Questions table – displays the questions assigned to that type (see Example below)
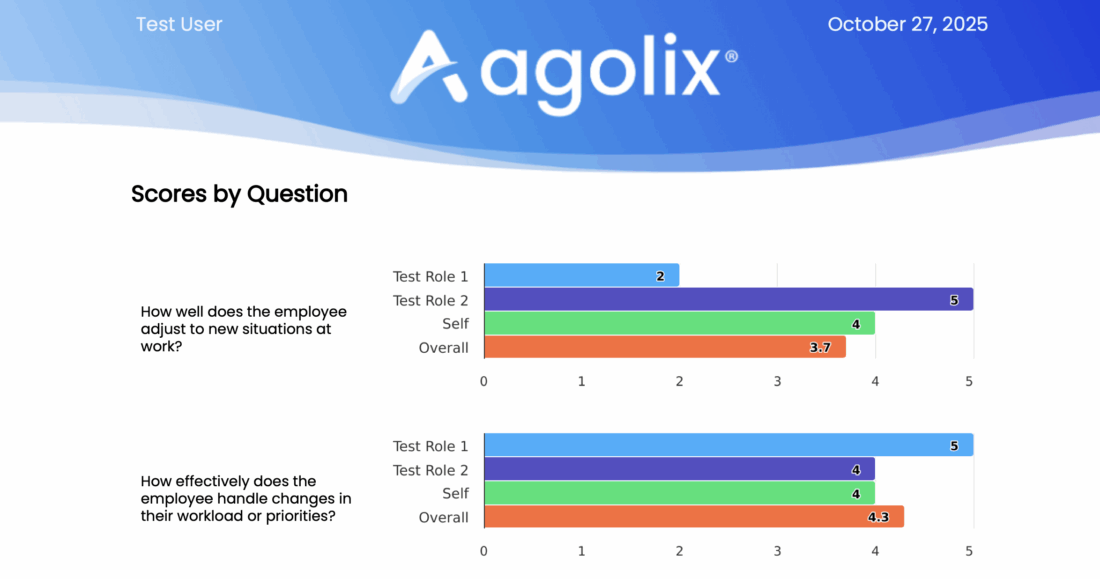
- Include Questions Charts – Displays Bar charts for each question (see Example below) (option to add a page break before)

Example of Questions Table #
Example of Questions Chart #
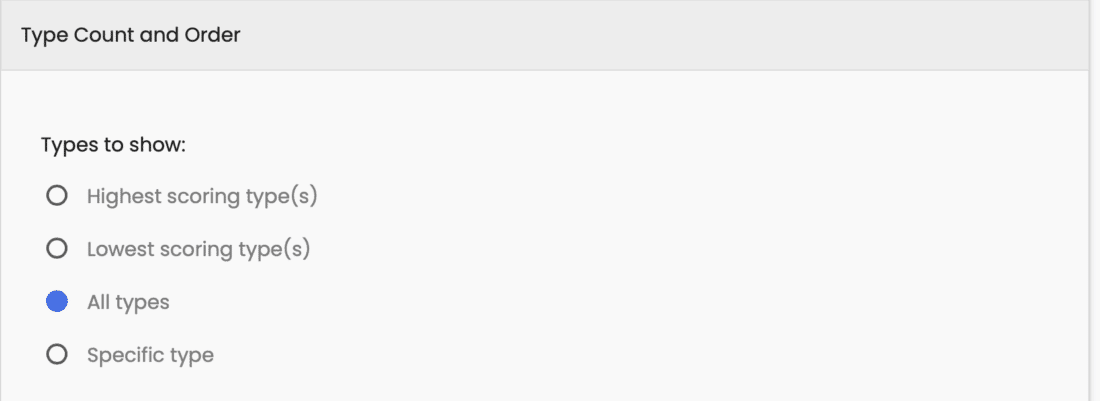
Type Count and Order #
Choose to show in the Report: the Highest scoring type(s), or Lowest scoring types(s), or All types, or a Specific type.
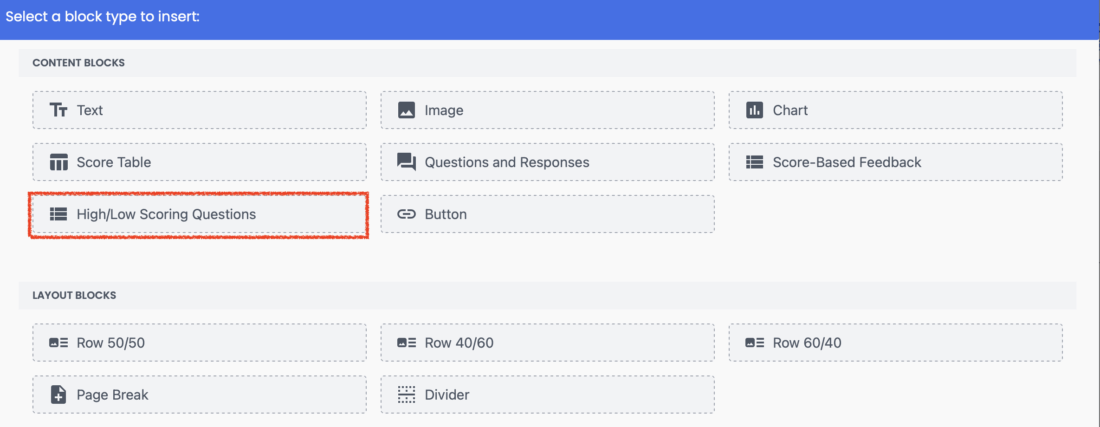
Add a High/Low Scoring Questions Block #
Click the blue “+” sign to add a block, select “High/Low Scoring Questions“ then “Close” to add this content to your Report.
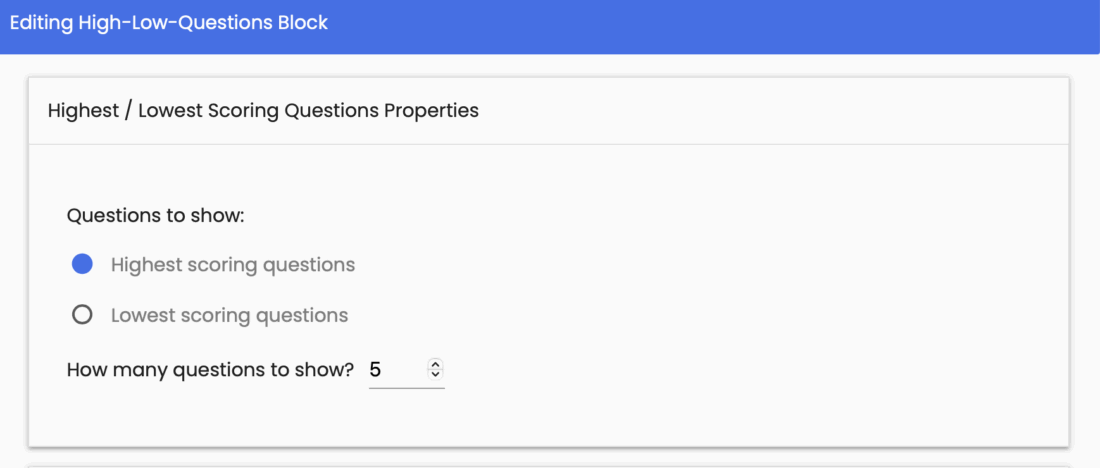
Once this block is created, Edit it and choose the number of Highest scoring questions or Lowest scoring questions to show in the Report.
Margins & Paddings #
Also configurable here are the Block Margins and Paddings. To learn more about Margins and Paddings, please see Block Spacing Settings.
Save Changes #
Click the “Save” button to save your work.
Add a Button Block #
When you click the blue “+” sign, click on “Button” then “Close” to add a Block with a clickable Button to your Report.
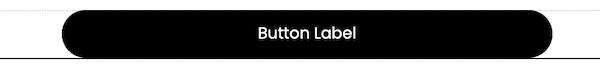
A default black Button appears as a placeholder. Click the blue Edit button to change your Button settings.
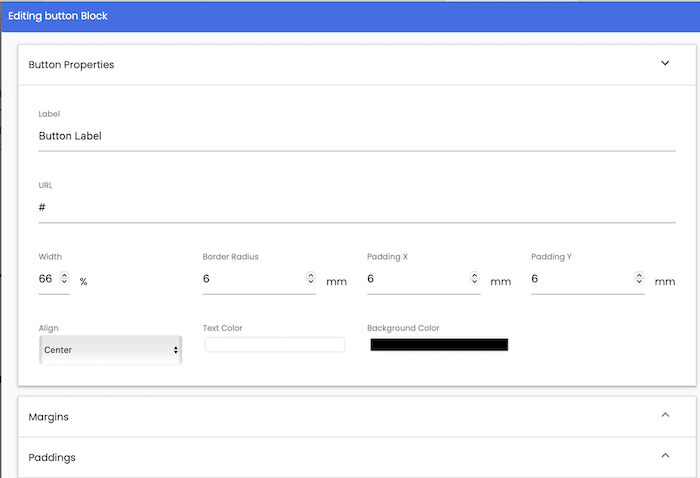
Button Text & URL #
Edit the Label field to enter the text that you want to appear and enter a URL destination in the field below.
Button Specifications #
Also available are settings for Button Width, Border Radius, Padding X (horizontal), Padding Y (vertical), Alignment, Text Color, and Background Color.
Some common Button labels are: Contact Me, Schedule a Call, Learn More, Get Started and Click Here for Details.
Margins & Paddings #
Also configurable here are the Block Margins and Paddings. To learn more about Margins and Paddings, please see Block Spacing Settings.
Save Changes #
Click the “Save” button to save your work.
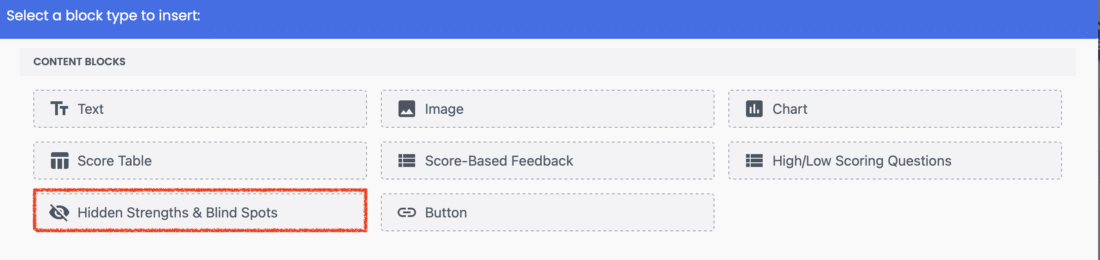
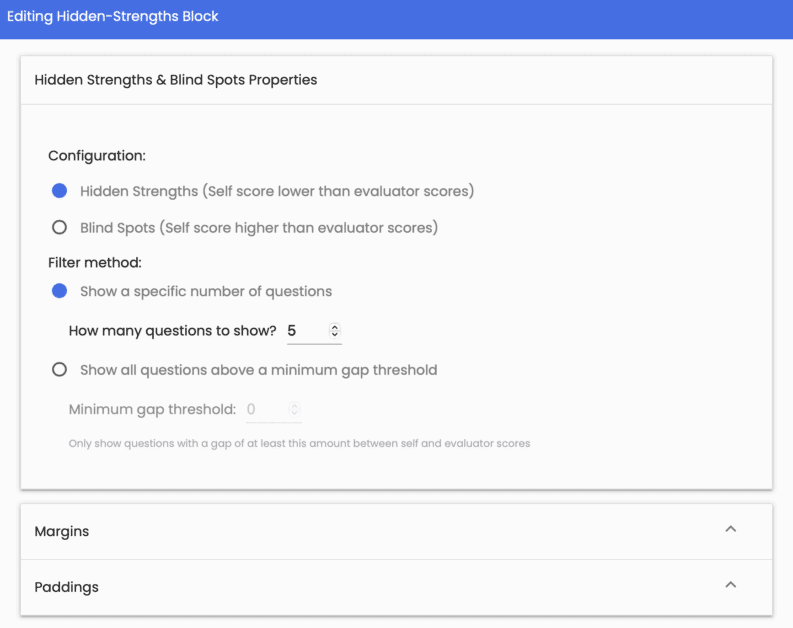
For 360° Assessments Add a Hidden Strengths and Blind Spots Block #
Configuration: Choose to show in the Report either the respondent’s Hidden Strengths (Self score lower than evaluator scores) OR Blind Spots (Self score higher than evaluator scores)
Filter Method: Choose to show a specific number of questions OR Show all questions above a minimum gap threshold.
Margins & Paddings #
Also configurable here are the Block Margins and Paddings. To learn more about Margins and Paddings, please see Block Spacing Settings.
Save Changes #
Click the “Save” button to save your work
Please review the rest of the Reference Guide to learn more about our software.
Thank you for choosing Agolix!